
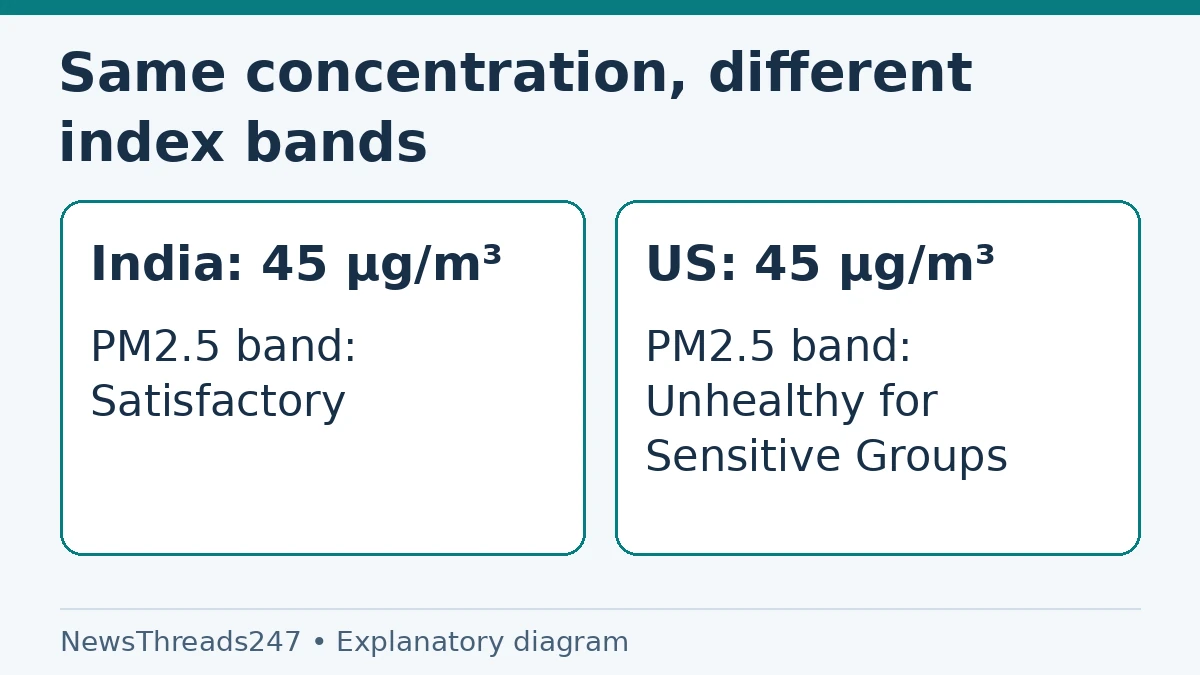
One app calls the air satisfactory; another shows an orange warning for the same city. Before deciding that a monitor is broken, check which air-quality index each app uses. India’s national AQI and the US AQI do not assign the same index values and categories to every pollutant concentration.
The location on the screen does not necessarily identify the scale. An app displaying an Indian city may use a US AQI setting. Compare the index system, pollutant, station and reporting period before comparing the numbers. This is a reading guide checked October 26, 2026, not a live pollution bulletin or an assessment of anyone’s medical condition.
AQI is an index, not the pollutant concentration
A PM2.5 concentration may be reported in micrograms per cubic metre, written µg/m³. AQI is a calculated index used to communicate air conditions. The same raw concentration can map to different index categories when the underlying breakpoints differ. Neither unit should be silently substituted for the other.
The Indian government’s national AQI explanation sets out pollutant-specific sub-indices and breakpoint ranges. AirNow’s US AQI explanation describes the EPA’s separate category system. Both are communication tools, but they are not interchangeable numerical scales.
This matters when someone sends a screenshot without the app settings or legend. ‘AQI 150’ is incomplete information for a cross-system comparison. Ask which scale was selected and whether the number represents the overall AQI or a particular pollutant’s sub-index. A colour alone supplies even less context.
A PM2.5 example shows why the label changes
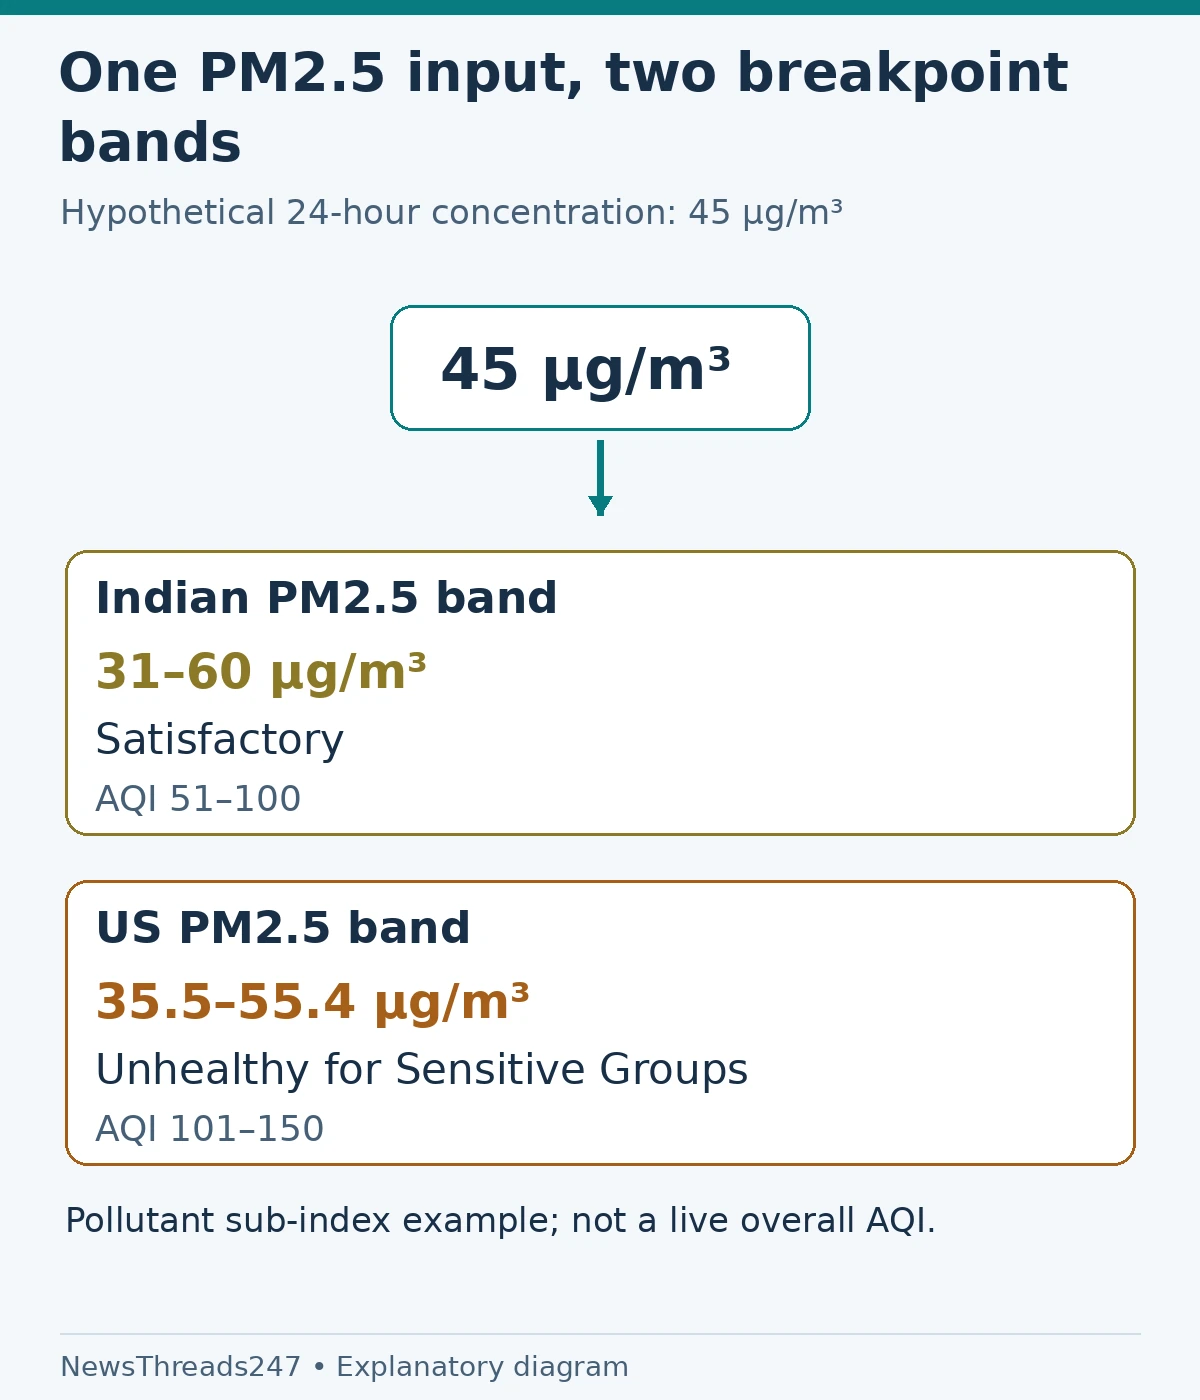
Take a hypothetical 24-hour PM2.5 concentration of 45 µg/m³. This is an illustrative input, not today’s reading for Delhi, Mumbai or any other city. In India’s published table it lies in the 31–60 µg/m³ PM2.5 range associated with the satisfactory AQI band.
In the EPA’s current 24-hour PM2.5 breakpoint table, 45 µg/m³ instead lies in the 35.5–55.4 range associated with ‘Unhealthy for Sensitive Groups’. The concentration in this example has not changed; the interpretation framework has. This is not a claim that either label makes the exposure harmless.
This comparison concerns the PM2.5 sub-index alone. An actual overall AQI can be driven by another pollutant, so the example cannot convert an arbitrary app’s overall number into another country’s overall number. It also cannot turn a short sensor reading into a properly comparable 24-hour concentration.
Read the category names with their own scale
| Index interval | Indian national AQI category | US AQI category |
|---|---|---|
| 0–50 | Good | Good |
| 51–100 | Satisfactory | Moderate |
| 101–150 | Moderate, within the 101–200 band | Unhealthy for Sensitive Groups |
| 151–200 | Moderate | Unhealthy |
| 201–300 | Poor | Very Unhealthy |
These are index intervals, not PM2.5 concentration intervals. The table compares labels, not equal exposures. The government’s pollution briefing gives India’s six bands through Very Poor and Severe; AirNow supplies the US system through Hazardous. Use the full legend attached to the reading for decisions.
Build a comparison from four matching fields
First record the scale. Look for Indian AQI, US AQI or the provider’s explicit methodology. If the app offers a setting, note its current selection rather than assuming a default. A setting changed last week can explain why a familiar location now appears with a different colour.
Next record the station or geographical area. A road-adjacent monitor, a neighbourhood sensor and a city summary are not the same observation. Two screenshots saying ‘Delhi’ may draw from different places. Use the source details to identify what each actually represents.
Then record the time and reporting period. A forecast for tomorrow, a daily summary and a current estimate answer different questions. Finally record the pollutant responsible for the displayed value. Only after these fields are understood should you investigate whether two apparently comparable observations disagree.
Overall AQI is not a simple pollutant average
India’s government briefing describes the worst-performing pollutant sub-index as determining the reported overall AQI. Do not average an app’s PM2.5 and PM10 index values to create your own overall figure. A smaller reading for one pollutant does not necessarily control the final category.
If one source shows PM2.5 and another shows overall AQI, label them correctly before sharing the comparison. An image of ‘45’ beside ‘150’ can look like a dramatic disagreement while comparing a concentration with an index. Preserve the units and pollutant names in any note or screenshot.
This is also why an overall index cannot be converted by multiplying by a universal ‘India-to-US AQI’ factor. The pollutant, concentration ranges and calculation basis matter. A website presenting a conversion needs to identify those inputs and the rules used; a single scale-free number is insufficient.
What to do when the readings still disagree
Imagine two fictional apps set to the same index system. One uses a station several kilometres away and a daily figure; the other uses a nearer sensor’s current estimate. Matching their colours by changing settings would not repair that geographical and time difference. Instead, compare like-for-like records from the source.
Use the relevant public monitoring service and its notes to understand the local observation. AirNow identifies current and forecast information separately, and India’s public reporting explains its monitoring framework. If data are missing or a station is unavailable, do not treat a blank field as a zero-pollution result.
For a suspected bad reading, preserve the station, timestamp, units and source link when asking the provider about it. A report that says ‘this station showed this pollutant at this time’ is easier to investigate than ‘your app is wrong’. Do not declare a sensor fraudulent merely because it differs from another app.
Use the advisory, not a competition between apps
For outdoor plans, follow the local authority’s current advice using the scale attached to it. People with conditions or sensitivities should follow the relevant professional guidance for their circumstances. A measurement explainer cannot diagnose symptoms or define a universally safe exposure for every person.
If you are comparing indoor equipment with outdoor AQI, another distinction matters: an air purifier’s display and a city’s ambient-air index are not automatically the same measurement. Check what the device measures and how its indicator works. Our room-size and CADR buying guide addresses the separate question of choosing filtration for a room.
When sharing a reading, keep its context attached. A useful message names the source, station or area, timestamp, index system and pollutant or overall status. That small amount of detail prevents more confusion than a large screenshot with only a red number circled.
Sources and visual credits
Sources: Indian Economic Service’s national AQI explanation, the government pollution briefing, EPA’s AQI breakpoint table and AirNow’s AQI basics, linked above and checked October 26, 2026. The 45 µg/m³ comparison is hypothetical and concerns 24-hour PM2.5 sub-indices, not an overall AQI forecast. Featured image: AI-generated conceptual illustration. Scale and comparison diagrams: NewsThreads247.