
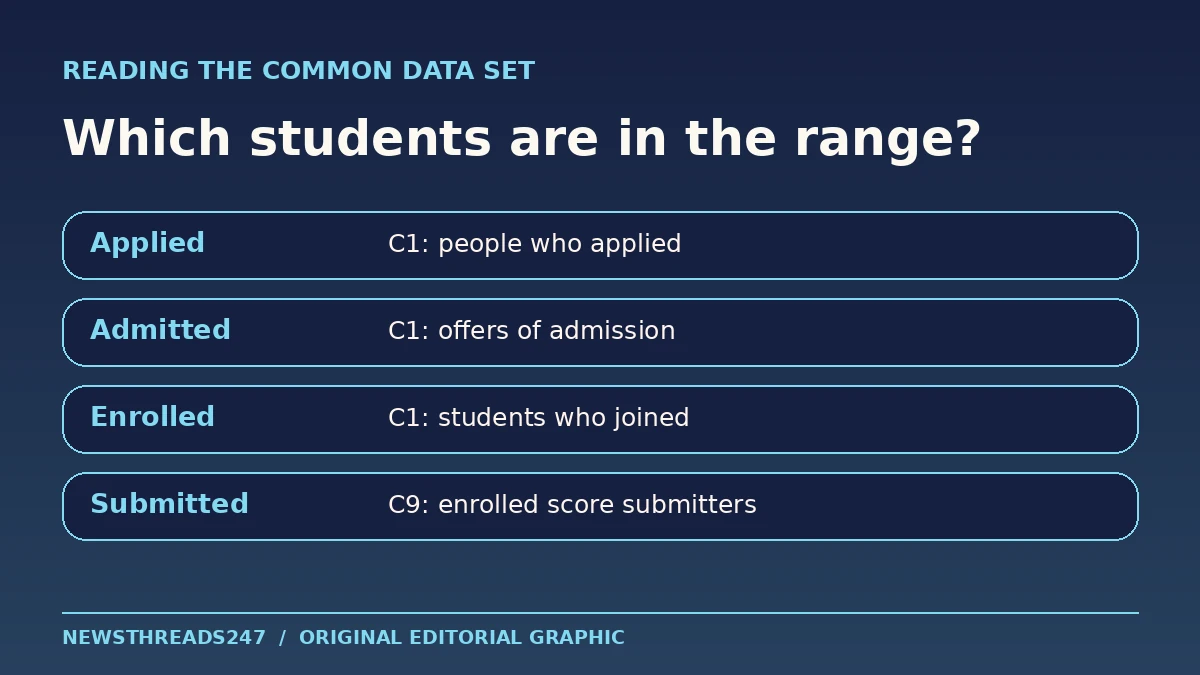
A college’s Common Data Set can tell you what past enrolled students scored. It cannot tell you what score will get you in. To make sense of a US college’s reported SAT or ACT range, read three things together: the enrollment year, the share of first-year students who submitted that test and the percentile range. The number most likely to change your interpretation is often the one outside the range: how many students it represents.
In this article
Find the report and identify the class
Start with the university’s institutional research or reporting office. Search the college name and “Common Data Set,” then confirm the campus, report year and cohort in Section C. A university system may have separate reports for different campuses. Save the source link and write down the fall enrollment year so you can compare two schools on the same basis. If the latest accessible reports cover different years, label that difference instead of quietly treating them as contemporaneous.
The Common Data Set Initiative sets standard definitions so colleges can report comparable information. The MIT institutional research archive shows the format in use and lets readers navigate between reporting years. In C1, applicants, admitted students and enrolled students are distinct groups. An admitted student who chose a different college is not part of the enrolled group whose scores you are about to read. A transfer applicant needs the college’s transfer policies and data; this first-year table is a poor substitute.
Read C9 as a description of score submitters
Find the number and percentage submitting each test before reading any percentiles. Keep the SAT and ACT rows separate. Some students may have submitted both, so adding the two percentages does not reliably tell you the share that submitted either. For the same reason, the ACT reporting percentage does not tell you how many of those students are absent from the SAT sample.
In the CDS reporting template, C9 describes enrolled first-year students who submitted scores. The 25th and 75th percentiles mark the approximate boundaries of the middle half of the reported scores; ties can make the share at each boundary less intuitive. The 50th percentile, when reported, is the median. A score at the lower boundary is not a minimum requirement, and a score at the upper boundary is no promise of admission. Santa Clara University’s reporting notes explain the cohort and percentile convention in a real institution’s documentation.
Keep SAT composite and section scores separate. A math percentile and a reading and writing percentile need not come from the same students, so adding two section percentiles does not reconstruct the composite percentile. Compare composite to composite and section to section. If a cell is blank or marked unavailable, record it as missing; it does not establish that nobody took the test.
For a real historical example, MIT’s 2024–25 report shows 918 SAT submitters (83% of the first-year cohort), 323 ACT submitters (29%) and an SAT composite range of 1,520–1,570. The two submission percentages add to 112% because they are not mutually exclusive. That is an illustration of how to read the table; check the university’s newer report and current entry requirements for your own application.
Work through two ranges with different coverage
Suppose Colleges A and B each enrolled 1,000 first-year students in the same fall. College A reports a middle SAT range of 1,300–1,450 and says 900 enrolled students submitted an SAT score. College B reports 1,350–1,500, but just 300 submitted that test. These are illustrative figures, not results from named colleges.
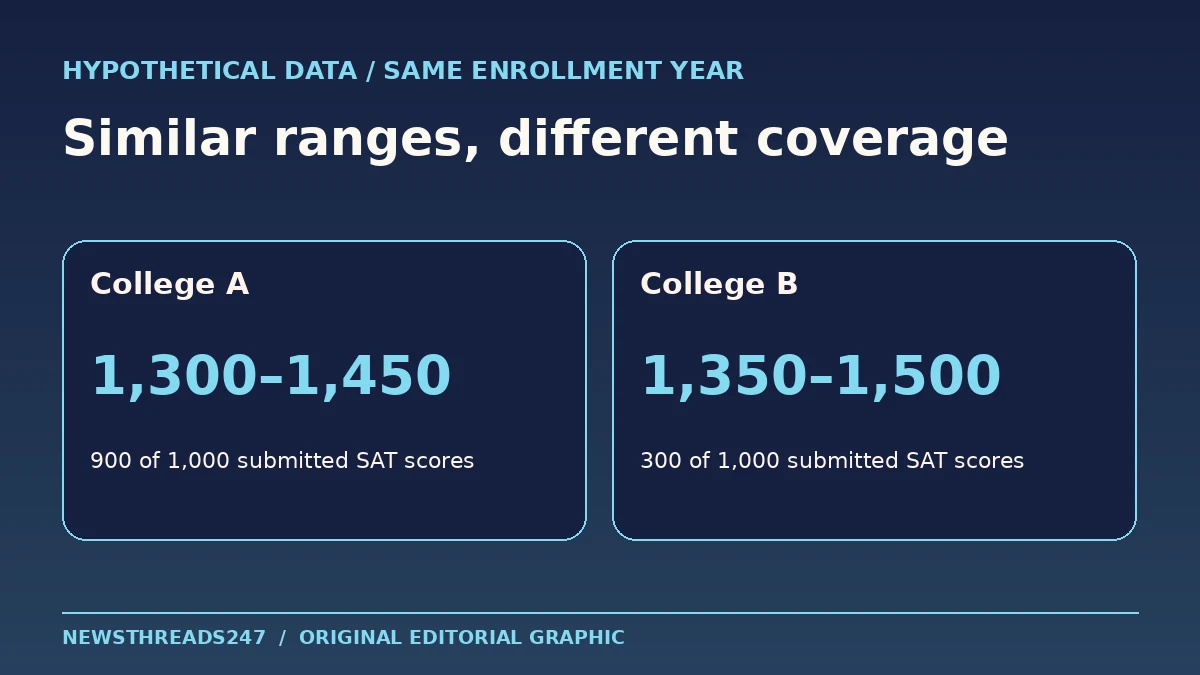
A reader with a 1,400 can say that the score lies inside both historical ranges. They can also say that A’s range describes a much larger share of its enrolled class. They cannot conclude that B’s entire incoming class scored higher or that admission there was harder. B’s score submitters may differ from the rest of the class in ways the table does not reveal. Neither range tells you how many applicants with 1,400 were admitted, how the school weighed their grades or which students decided not to enroll.
If you also compare application and enrollment counts from C1, keep those figures in a separate column. A college’s share of all applicants admitted is a school-wide historical measure. Pairing it with C9 does not turn it into your personal chance, an international applicant admit rate or a rate for a particular major.
Use current instructions for the decision to send scores
A historical table can frame a question: “How does my score compare with those this school reported?” The official admissions instructions for your entry term answer a different question: “May I choose whether to send it?” Open those instructions for the right campus and application type. Check whether requirements differ for a program, scholarship, homeschooled applicant or international applicant, and check whether another policy applies to English proficiency. A prior-year policy row is context and can be out of date.
When submission is optional for your specific application, consider what the score adds to the rest of your file. If the data cover few students or omit the relevant score, give the comparison less weight. If the written policy is ambiguous, ask admissions a narrow question with your entry term and program in it. Save their answer alongside the policy page rather than extrapolating from another college.
Make a comparison you can reuse
Give each school one row with these columns: campus, cohort, SAT submitters, SAT composite range, ACT submitters, ACT composite range and current policy link. Add a short note when the figures refer to a limited population or years differ. Recheck after the next dataset release and again before sending scores. Then compare cost separately with a college net price estimate; a good statistical fit is a different question from a college you can afford.
The useful takeaway is modest: report the range and its denominator in the same sentence. If you cannot identify who is represented, leave the comparison open instead of turning the table into an admissions prediction.