
If you have twenty minutes to read a research paper, choose one claim and trace it to the evidence. Find the figure or table that supports it, read the caption, then check how the authors collected and compared the data. You may understand one result well before you understand the entire paper. That is a useful place to start.
In this article
Find out what kind of paper you have
A paper that reports a new experiment, survey or set of observations gives you methods and results to inspect. A review asks a different question: how the authors selected and combined earlier work. An editorial may argue for a position without collecting new data at all. Identify the kind of article before expecting it to provide a certain kind of proof.
Use the abstract to locate the main question and a result worth testing. Turn that result into your own short sentence. “The authors found an association between two measures in this sample” is a much easier sentence to verify than “the paper proves this technique works.” The PLOS guide to reading scientific papers treats active questioning and checking the data displays as part of reading, rather than taking the abstract as the last word.
If the publication describes itself as a preprint, check whether the version you are reading has been peer reviewed or superseded. Peer review helps with scrutiny; it still does not tell you whether the evidence answers your specific question.
Read the caption before interpreting the pattern
Write down what each axis measures, the units and whether values are percentages or counts. Check the legend for the identity of each group. Ask whether a dot is one participant, one classroom or an average. These choices change what a reader can infer even when the line on the chart looks the same.
Check what any error bars represent. They might describe variation among observations or uncertainty in an estimate. Do not guess the definition from their shape or use overlapping bars as a universal significance test. If the caption leaves this out, look in the methods or supplementary notes.
If the display compares percentages, look for the denominator. Twenty percent could mean two of ten or two hundred of a thousand. Both display as the same percentage; they do not give you equally precise information about the underlying group. Find the counts, check which observations are included and notice whether some participants dropped out.
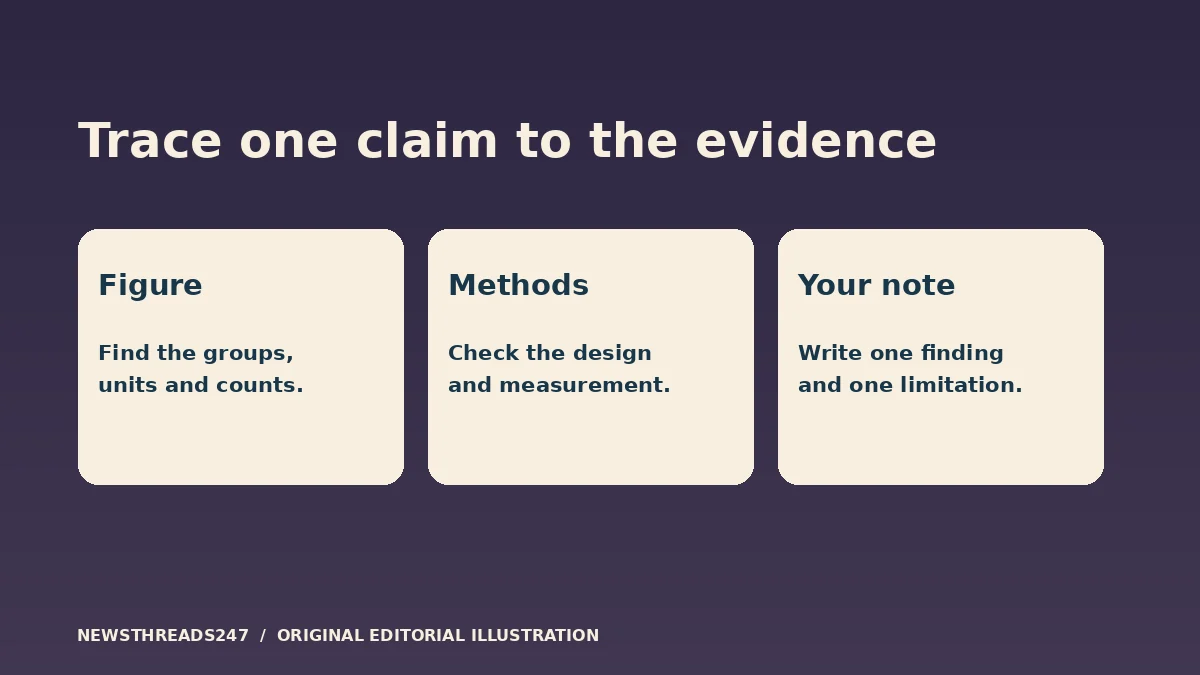
Read only the methods that answer your claim first
Duke’s guide to reading a scientific paper recommends working through the relevant figures and methods instead of treating a paper like a novel. If your claim is about a difference between two groups, look for who joined the study, what each group did, how groups were formed, what was measured and when. For an observational study, look for factors that might differ between the groups besides the factor being discussed.
Return to the caption with that information. A label such as “week four” might refer to the people who completed the study, not everyone initially enrolled. A reading measured immediately after training does not answer whether it lasted six months. Neither detail is automatically a flaw. Each limits the sentence you can responsibly write.
Read the authors’ discussion after inspecting the result. Note where their interpretation goes further than the measurement. A proposed explanation may be scientifically plausible while remaining untested in the study. Look for what they list as limitations, then ask what the paper could not possibly have measured given its design.
Try it on a fictional classroom result
Imagine a paper compares quiz scores in two classes. Class A averaged 78 out of 100 and Class B averaged 72. The gap is six points on the scale, not an automatic six percent improvement for every student. It also does not by itself establish that the difference was caused by the lesson.
The methods say each class used a different teacher, and students were not randomly assigned. The figure reports only the quiz at the end. A careful note might say: “In this comparison the classes’ average scores differed by six points; the study does not isolate the effect of the lesson.” To assess a stronger claim, look for baseline performance, sample sizes, missing scores and the uncertainty in the comparison.
Now change one detail: the second class took a harder quiz. The numerical difference is still six points, but the two scores may no longer be comparable. Your note needs to identify the different assessments before interpreting any gap. This is why tracing the result to its measurement is useful even when the arithmetic is easy.
Finish with a note you can use again
Record the paper title, version or date, figure number, the population, the measurement and one limitation. Then write two sentences: what the evidence supports, and what you would still need to know. Keep a link back to the original so you can check the wording before using it in a presentation or assignment.
Test your understanding by closing the paper and explaining the figure aloud, then reopening it to correct anything you forgot. The retrieval practice guide explains how to make that memory check useful. If you cannot name the groups or explain what the axis measures, return to those details instead of rereading the entire introduction.